Product Designer
at Justuno
at Justuno


Resources, such as heatmapping and talking to users of all types - including our partners and our own services team - provided a few key insights:
Where: the home page is the most popular page viewed.
Jobs to be done: users were commonly struggling to find "what to do next" without reaching out to our team.
Too much to look at: the current home page left users with a sense of "decision fatigue".
Hand-holding: our team was asked to help users find the key performance indicators they were looking for.

Simplified Visual Hierarchy: Implemented a single-column card layout for easy scrolling and improved information architecture.
Key Performance Indicator Prioritization: Identified KPIs through customer success, agency partner, and "80/20" customer interviews. Consolidated these into a tabbed chart to reduce cognitive load.
Guided Onboarding: Added a "recommended use case" carousel and an account checklist to guide users on what to do next. Included links to helpful documentation (webinars, videos, and office hours).
Recent Workflow Bookmark: Created a chronological list of recently published workflows, allowing users to quickly return to their work.

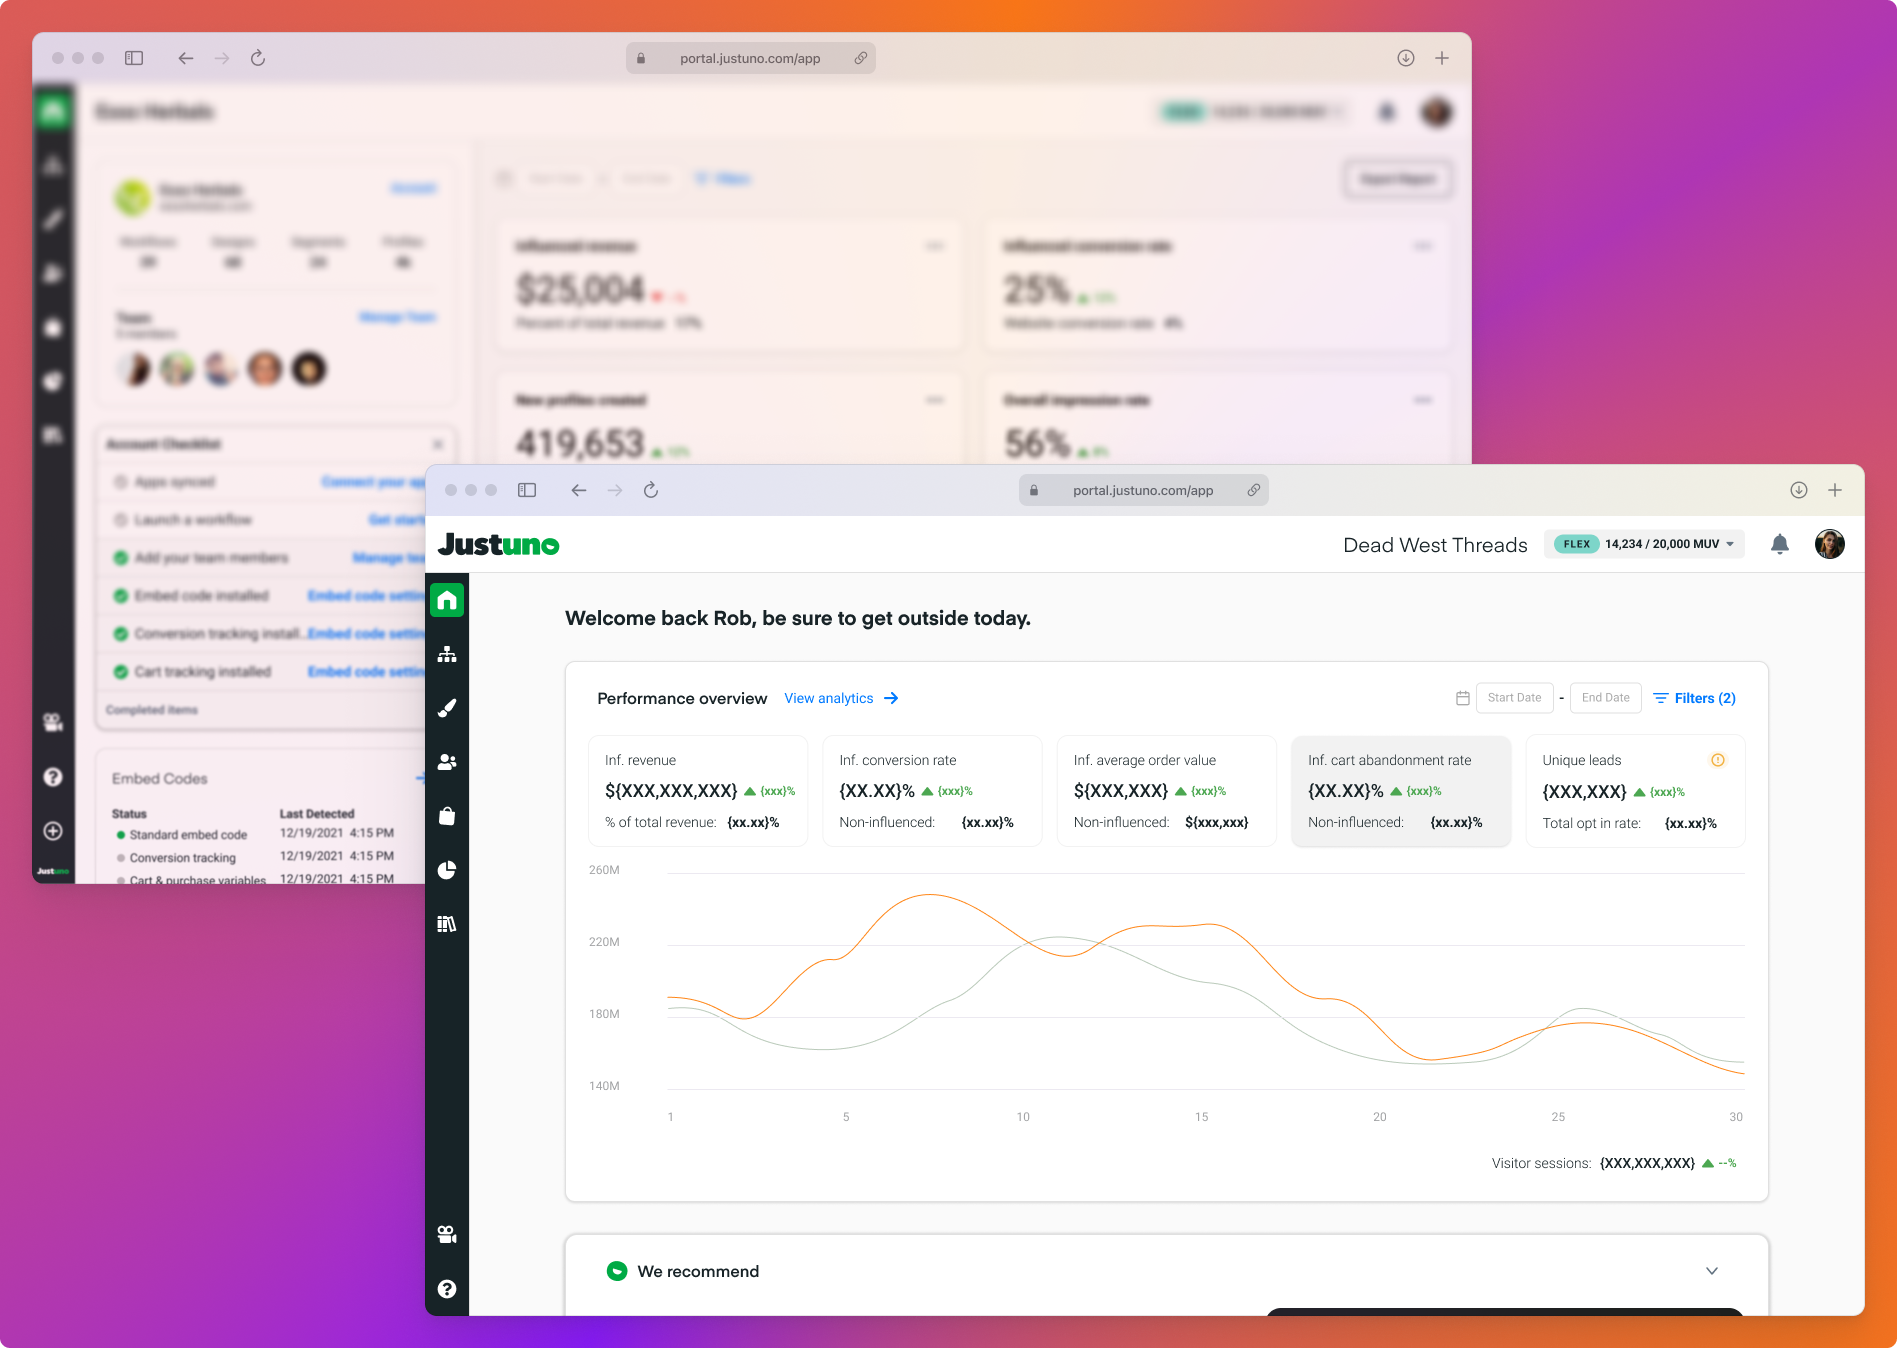
Anecdotally, we felt there was a moment to humanize the app, to let users know that we understand how working through various SaaS products every day can begin to feel sterile. We decided to add a weekly encouraging headline: "Your to-do list doesn't stand a chance.", "don't forget to drink some water.", and "be sure to get outside today." were some crowdsourced favorites.
Our previous home dashboard attempted to report on all key metrics, all at once. It also attempted to put many administrative settings into a double column layout, i.e. team size, number of workflows live, and. embed code status.
The new home dashboard improves the user experience, and refined the information architecture to present a simplified view the top-requested metrics, jobs-to-be-done, and less prioritized resources below the fold.